2.3 Sampling Methods
The sampling process begins by defining the frame - a listing of items that make up the population. A frame could be population lists, maps, directories, etc. For our Truman example above, the frame was incorrectly chosen to be a list of registered vehicle owners (so the poll was doomed from the start).
A sample is drawn from a frame. The sample could be a nonprobability sample or a probability sample. The items in a nonprobability sample are selected without knowing their probabilities of selection. This is usually done out of convenience (e.g., all voluntary responses to a survey or selecting the top or bottom of a frame). While these samples are quick, convenient, & inexpensive, they most likely suffer from selection bias. We can perform (albeit, incorrectly) statistical analyses on these samples, but we are going to restrict attention to probability samples which are selected based on known probabilities.
2.3.1 Simple random sampling

Figure 2.2: Simple Random Sampling
In a simple random sample, every item in a frame has an equal chance of being selected.
The chance (or probability) of being selected depends on if you’re selecting…
- With replacement (1/N chance for all)
- Without replacement (1/N, 1/(N-1), 1/(N-2), …)
Examples of simple random sampling methods:
- Fishbowl methods
- random number indexing
Advantages:
Simple random sampling is associated with the minimum amount of sampling bias compared to other sampling methods.
If the sample frame is available, selecting a random sample is very easy.
Disadvantages:
Simple random sampling requires a list of all potential respondents (sampling frame) to be available beforehand - which can be costly.
The necessity to have a large sample size (i.e., lots of observations) can be a major disadvantage in practical levels
2.3.2 Systematic Sampling

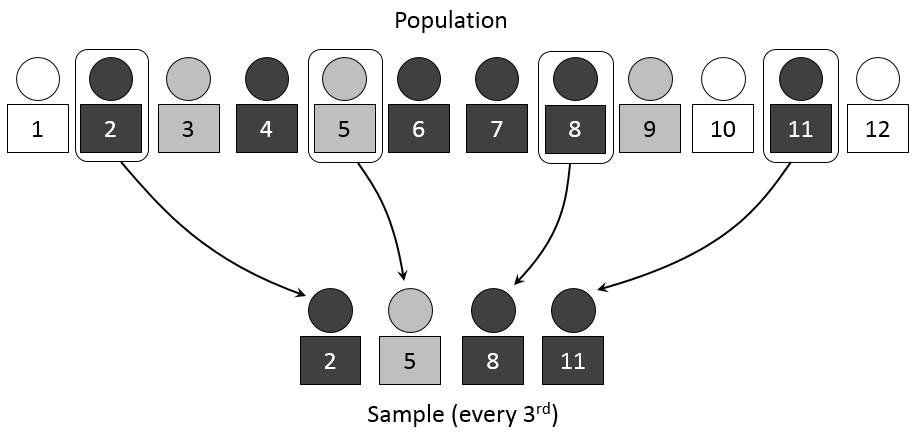
Figure 2.3: Systematic Sampling
A systematic sample begins with partitioning the N items in a frame into n groups of k items
\[k=\frac{N}{n}\]
randomly select a number from 1 through k
select the kth member from each of the n groups
For example: Suppose you want a sample n=40 out of N=800.
Divide the population into k=20 groups.
Select a number from 1-20 (e.g. 8)
Sample becomes items 8,28,48,68,88,…
Advantages
it will approximate the results of simple random sampling
it is cost and time efficient
Disadvantages
it can be applied only if the complete list of a population is available
the sample will be biased if there are periodic patterns in the frame
2.3.3 Stratified Sampling

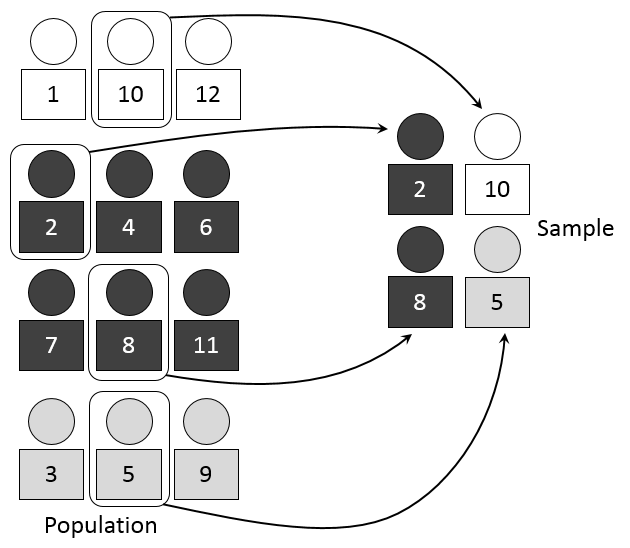
Figure 2.4: Stratified Sampling
A stratified sample divides the N items in the frame into important sub-populations (strata)
- Each strata groups items according to some shared characteristic (gender, education, etc.)
Once these strata are constructed. A researcher selects a simple random sample from each strata and combines.
Advantages
it is superior to simple random sampling because it reduces sampling error and ensures a greater level of representation
ensures adequate representation of all subgroups
when there is homogeneity within strata and heterogeneity between strata, the estimates can be as precise (or even more precise) as with the use of simple random sampling
Disadvantages
requires the knowledge of strata membership
process may take longer and prove to be more expensive due to the extra stage in the sampling procedure
2.3.4 Cluster Sampling

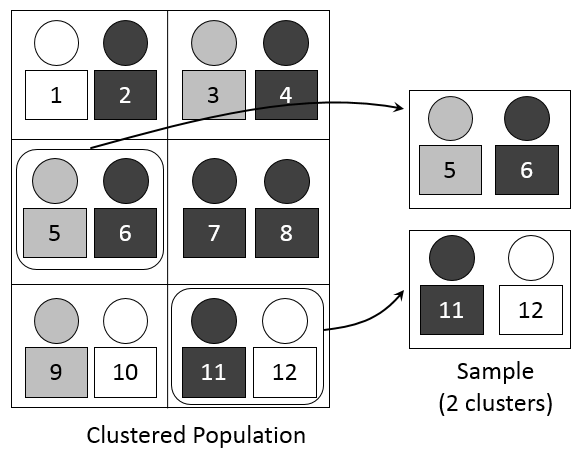
Figure 2.5: Cluster Sampling
Cluster Sampling occurs when you break the sample frame into specific groups (i.e., clusters) and then randomly select several clusters as your sample. An example of this method is the consumer price index (CPI) which is a measure of inflation calculated by the Bureau of Labor Statistics in the U.S. (US BLS). When trying to estimate the overall change in a basket of consumption goods across the US, the BLS breaks the US into metropolitan statistical areas (MSAs) and treats each one as a cluster. The BLS then goes and prices the various goods in the clusters selected for analysis.
Advantages:
the most time-efficient and cost-efficient probability design for large geographical areas
easy to use
larger sample size can be used due to increased level of accessibility of perspective sample group members
Disadvantages
requires group-level information to be known
commonly has higher sampling error than other sampling techniques
may fail to reflect the diversity in the sampling frame