1.1 The “Big Picture” of Statistics
Question 1:
A wholesaler has an inventory of 100,000 light bulbs and wants to market them. What can be said about the lifespan of the light bulbs in this inventory?

Figure 1.1: How do we know so much about this unused lightbulb?
Question 2:
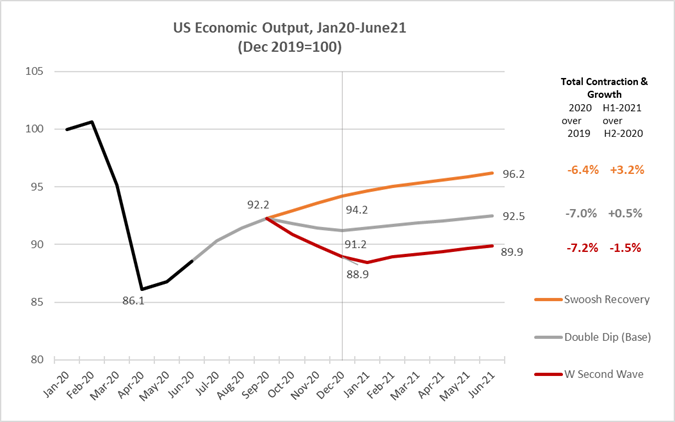
An economist wants to forecast the future state of output in the economy. What variables (i.e., leading indicators) should be included in her model? How much confidence should we place in her predictions?

Figure 1.2: The Dismal Science
Question 3:
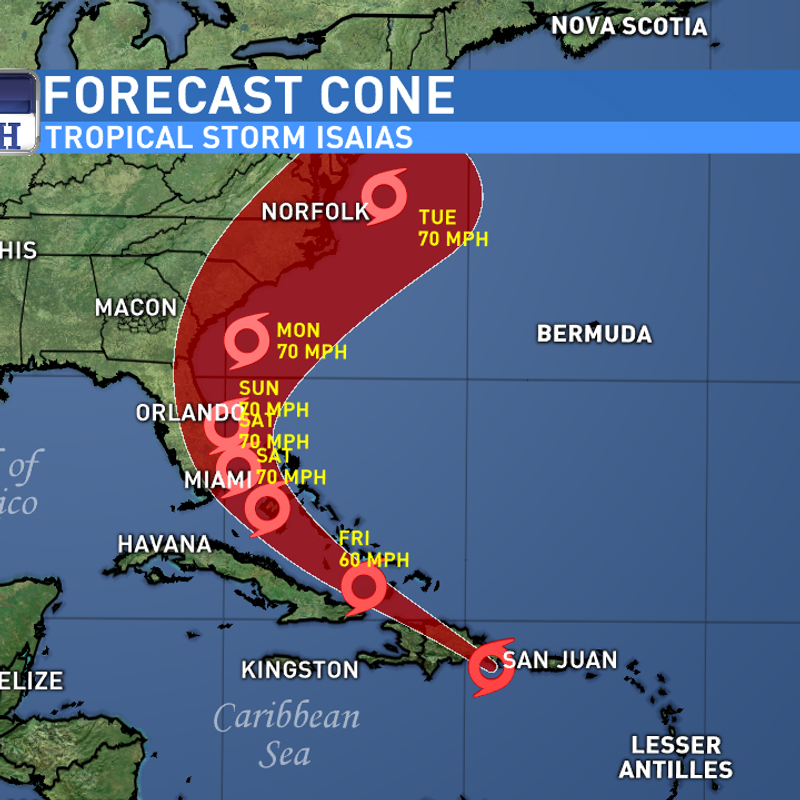
A meteorologist wants to predict the path of a hurricane. How confident can we be in her predicted path of the storm?

Figure 1.3: The Cone of Uncertainty
These and many more relevant questions can be answered (as best as possible) using statistics.
Statistics is the branch of mathematics that transforms data into useful information for decision makers. Statistics are used to summarize data, draw conclusions, make forecasts, and make better sense of the world and the decisions we make within it.
Statistics is broken into two related branches.
Descriptive statistics are used to summarize, analyze, and present data. Since the values of a dataset are in hand (i.e., observable), the descriptive statistics of a dataset are facts.
Inferential statistics use the descriptive statistics from the data to draw conclusions about a larger group of observations that at the moment are impossible (or too expensive) to observe. Since this larger group of data is not in hand, the inferential statistics that stem from an analysis are predictions.